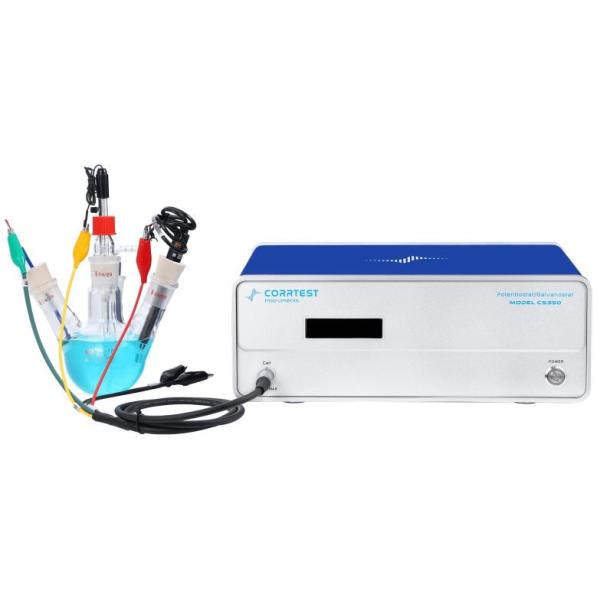
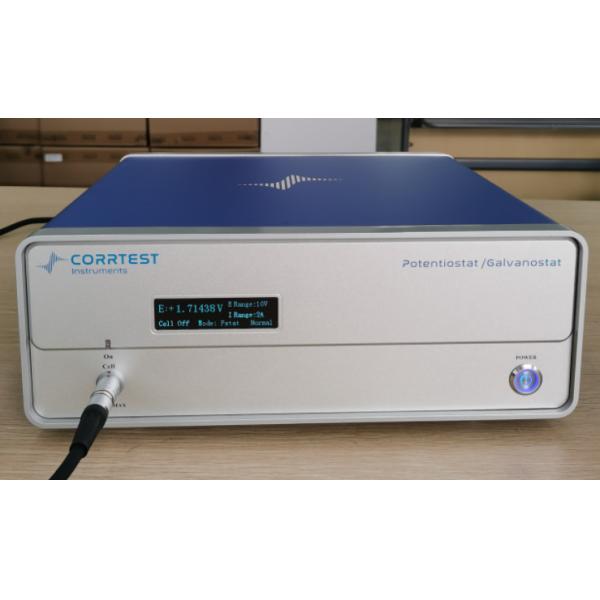
Specifications
Brand Name :
Corrtest
Model Number :
CS350M
Certification :
CE, ISO9001
Place of Origin :
Wuhan, China
MOQ :
1set
Price :
Negotiable
Payment Terms :
T/T, D/P
Supply Ability :
1set/year
Delivery Time :
5-10 working days
Packaging Details :
standard Box
Potential control range :
±10V
Current control range :
±2A
Potential control accuracy :
0.1%×full range±1mV
Current control accuracy: :
0.1%×full range
Potential resolution :
10μV (>100Hz),3μV (<10Hz)
Current sensitivity :
1pA
Rise time :
<1μs (<10mA), <10μs (<2A)
Reference electrode input impedance :
1012Ω||20pF
Current range :
2nA~2A, 10 ranges
Compliance voltage :
±21V
Description

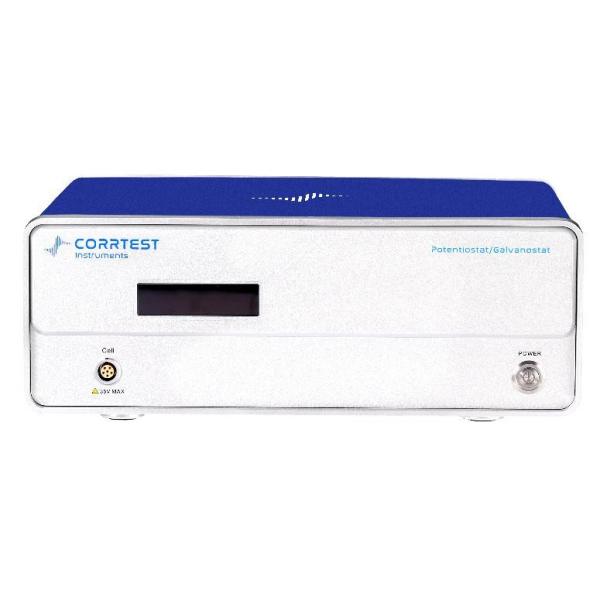
Electrochemical impedance spectroscopy potentiostat CS350M consists of high power high precision potentiostat/galvanostat,DDS arbitrary function generator, dual-channel correlation analyzer, dual-channel high-speed 16bit/high-precision 24bit AD converter and extension interfaces etc. Max. current is ±2A, potential range is ±10V. Compliance voltage is ±21V. Electrochemical impedance spectroscopy (EIS) frequency range is 10uHz~1MHz. It can be used for various electrochemical fields such as corrosion, energy, material and electroanalysis. The current can be boosted up to 20A/40A with a current booster CS2020B/ CS2040B. For the Electrochemical impedance spectroscopy EIS, we provide 7 different EIS techniques to meet the various requiments, such as Potentiostatic EIS (Nyquist, Bode), Galvanostatic EIS, Potentiostatic EIS (Optional freq.), Galvanostatic EIS(Optional freq.), Mott-Schottky, Potentiostatic EIS vs. Time (Single freq.), Galvanostatic EIS vs. Time (Single freq.). All the Corrtest Electrochemical impedance spectroscopy potentiostat provides eis equivalent circuit fitting in the software.

EIS Electrochemical Impedance Spectroscopy Potentiostat And Galvanostat CS350M

What is electrochemical impedance spectroscopy?

Electrochemical impedance spectroscopy (EIS) offers kinetic and mechanistic data of electrochemical systems and is widely used in corrosion study, energy conversion and storage, sensor and biosensing, etc. Electrochemical impedance spectroscopy (EIS) is usually measured by applying an AC potential to an electrochemical cell and then measuring the current through the cell. Electrochemical impedance spectroscopy characterizes the time response of electrochemical systems using low amplitude alternating current (AC) voltages over a range of frequencies. Using an electrode setup consisting of a working, reference, and counter electrodes a known voltage is passed from the working electrode through an electrolytic solution and into the counter electrode. Quantitative measurements are produced by the EIS and enable the evaluation of small scale electrochemical mechanisms at the electrode interface and within the electrolytic solution. The data collected with EIS are modeled with a suitable electrical equivalent circuit, resulting from an arrangement of elements Very few electrochemical cells can be modeled using a single equivalent circuit element. Instead, EIS models usually consist of a number of elements in a network. Both serial and parallel combinationsEIS Electrochemical Impedance Spectroscopy Potentiostat And Galvanostat CS350M of elements occur.

Applications of Electrochemical impedance spectroscopy potentiostat CS350M

Corrosion: Electrochemical impedance spectroscopy potentiostat CS350M includes all the electrochemical techniques for corrosion measurement such as OCP, polarization curve (potentiodynamic), EIS, Cyclic polarization CPP (passivation curve), Electrochemical Potentiokinetic Reactivation (EPR), Hydrogen diffusion test, ZRA, Electrochemical noise, etc. It can be used to study metal corrosion mechanism and corrosion resistance, and evaluate the coating durability and sacrificial anode current efficiency. It can also be used for rapid screening of corrosion inhibitors, fungicides, etc.

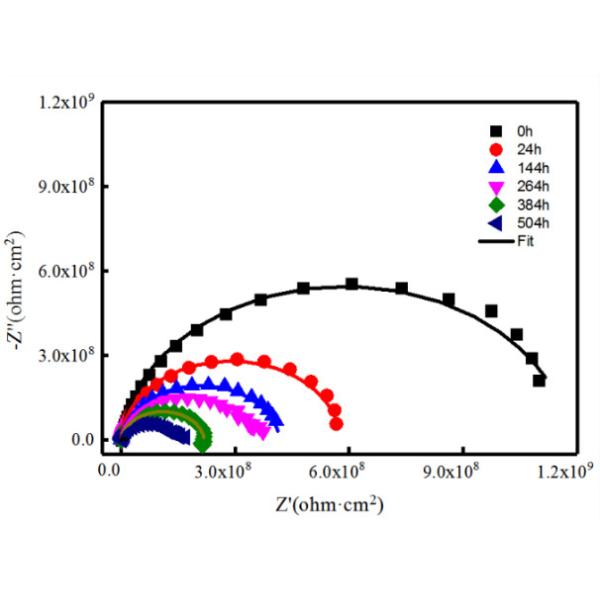
It uses correlation integral algorithm and dual-channel over- sampling technique, and has strong anti-interference ability. The internal resistance of the instrument is up to 1013Ω. It's suitable for EIS measurements of high-impedance system (such as coating, concrete etc)

Salt spray aging test of high impedance coating

EIS Electrochemical Impedance Spectroscopy Potentiostat And Galvanostat CS350MEIS Electrochemical Impedance Spectroscopy Potentiostat And Galvanostat CS350M

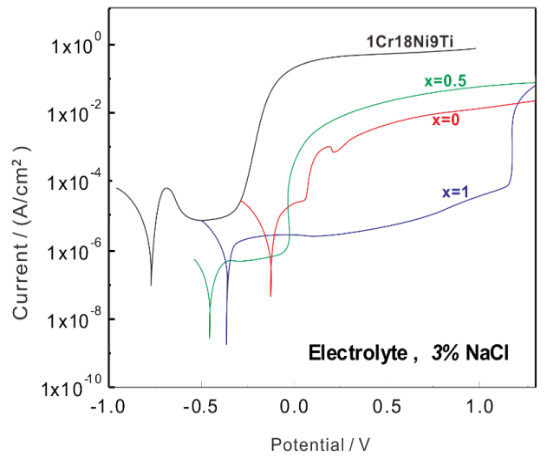
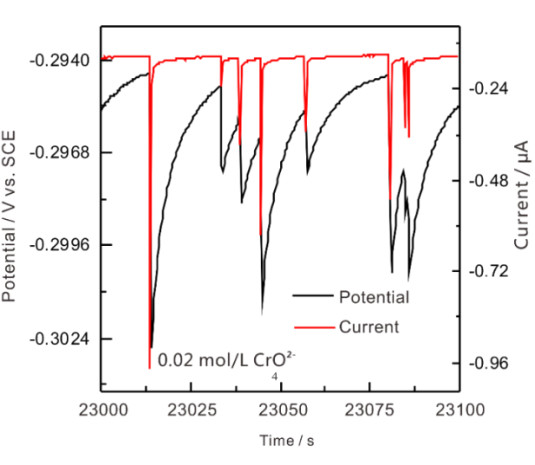
Left: Polarization curves of Ti-alloy& stainless steel in 3%NaCl solution Right: ECN of low-carbon steel in 0.05mol/LCl+0.1mol/LNaHCO3

Energy

With techniques LSV, CV, galvanostatic charge and discharge (GCD), Galvanostatic EIS, and precise IR compensation circuit, Electrochemical impedance spectroscopy potentiostat CS350M are widely used in supercapacitor, Li-ion batteries, sodium-ion batteries, fuel cell, Li-S batteries, solar cell, solid-state batteries, flow batteries, metal-air batteries etc. It is an excellent scientific tool for researchers in the fields of energy and materials.

EIS Electrochemical Impedance Spectroscopy Potentiostat And Galvanostat CS350M

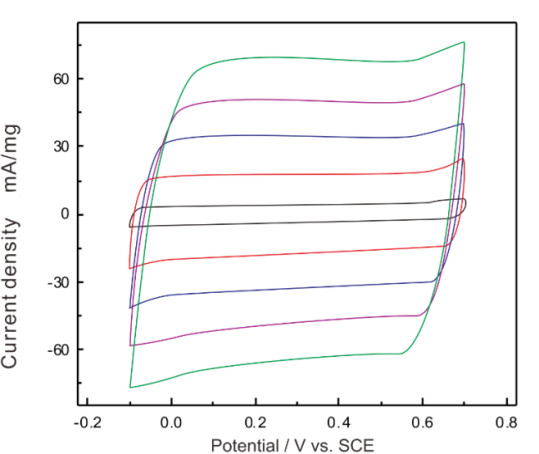
CV curve of PPy supercapacitor in 0.5 mol/L H2SO4 solution

EIS Electrochemical Impedance Spectroscopy Potentiostat And Galvanostat CS350M

Electro-catalysis

Electrochemical impedance spectroscopy potentiostat CS350M can measure the half-wave

potential (ORR), overpotential (HER, OER) of the catalyst, and has the function of peak power density and energy density calculation.

● Long-term cyclic measurement for ORR, OER, HER,

CO2RR by techniques such as cyclic voltammetry,

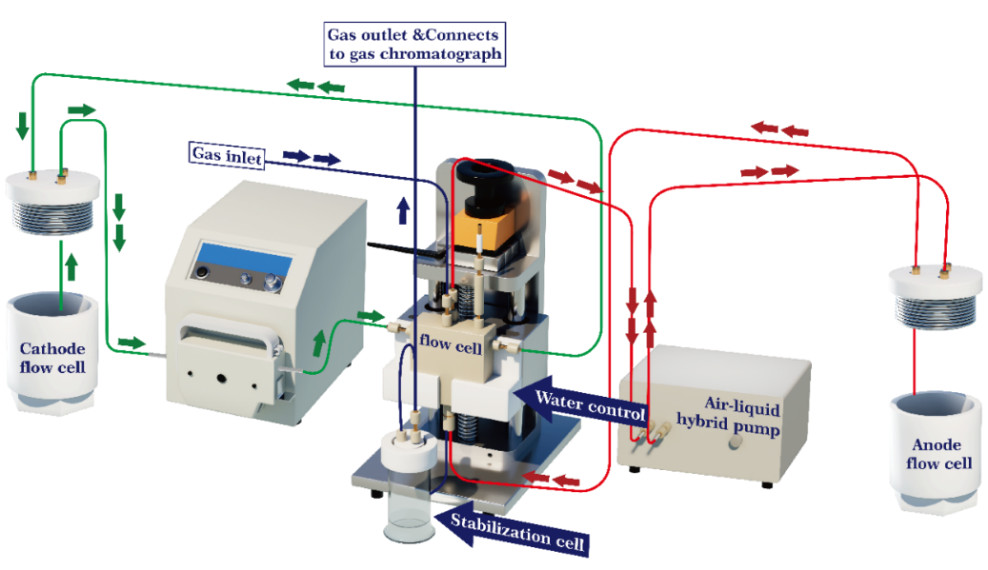
potentiostatic, galvanostatic. Faraday efficiency can be measured with a bipotentiostat.

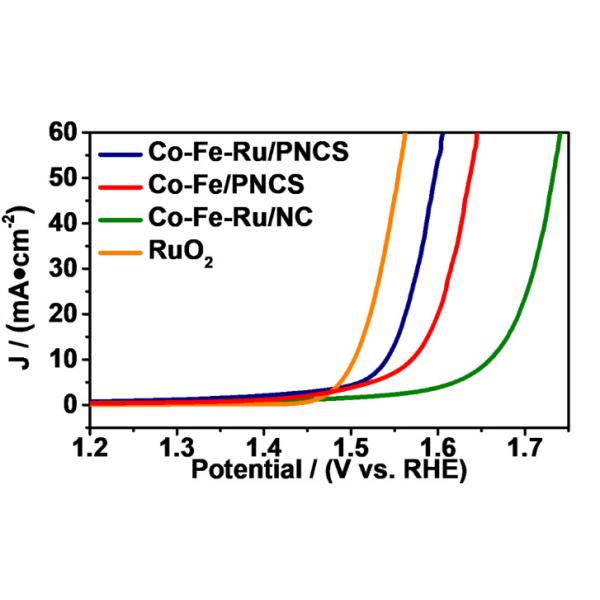
LSV curve of catalysts in alkaline solutio

EIS Electrochemical Impedance Spectroscopy Potentiostat And Galvanostat CS350M

● Maximum current can be 20A and compliance voltage can be 30V, and with IR compensation technique,

Electrochemical impedance spectroscopy potentiostat CS350M can precisely measure the overpotential of the electrode, which is a big advantage in electrocatalysis field.

Software Features of Electrochemical impedance spectroscopy potentiostat CS350M

Cyclic voltammetry: CS studio software provides users a versatile smoothing/ differential /integration kit, which can complete the calculation of peak height, peak area and peak potential of CV curves. In CV technique, during the data analysis, there is function of selecting exact cycle(s) to show.

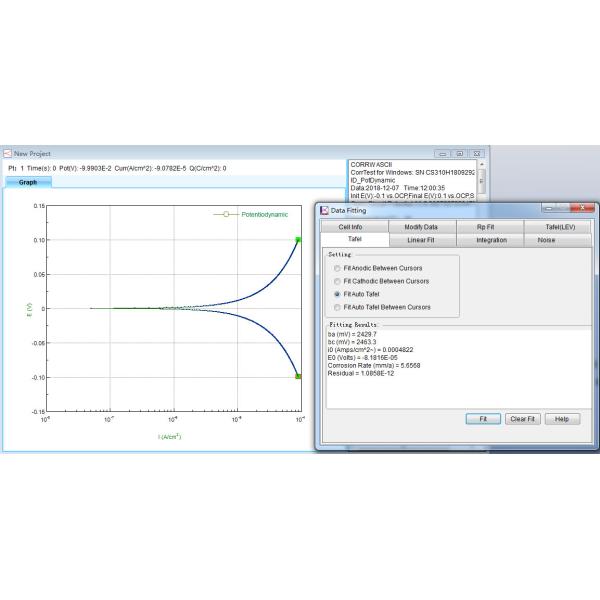
Tafel plot and corrosion rate: CS studio also provides powerful non-linear fitting on Butler-Volmer equation of polarization curve. It can calculate Tafel slope, corrosion current density, limitation current, polarization resistance, corrosion rate. It can also calculate the power spectrum density, noise resistance and noise spectrum resistance based on the ECN measurements.

EIS Electrochemical Impedance Spectroscopy Potentiostat And Galvanostat CS350M

Battery Test and analysis:

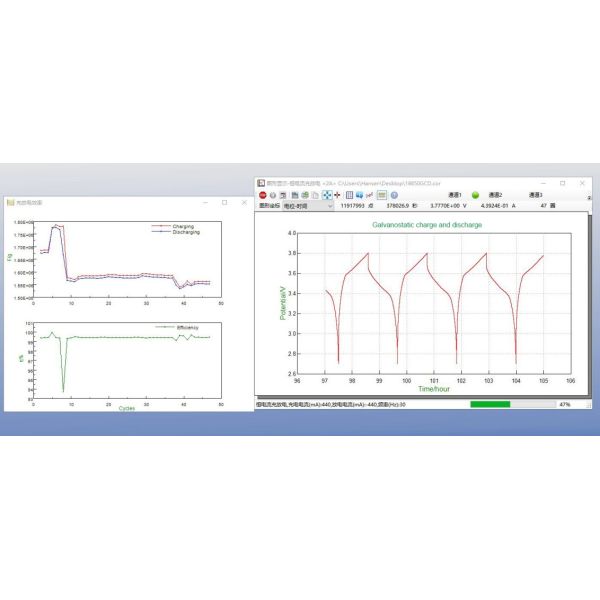
charge & discharge efficiency, capacity, specific capacitance, charge & discharge energy.

EIS Electrochemical Impedance Spectroscopy Potentiostat And Galvanostat CS350M

Electrochemical impedance spectroscopy (EIS) analysis: Bode, Nyquist, Mott-Schottky plot

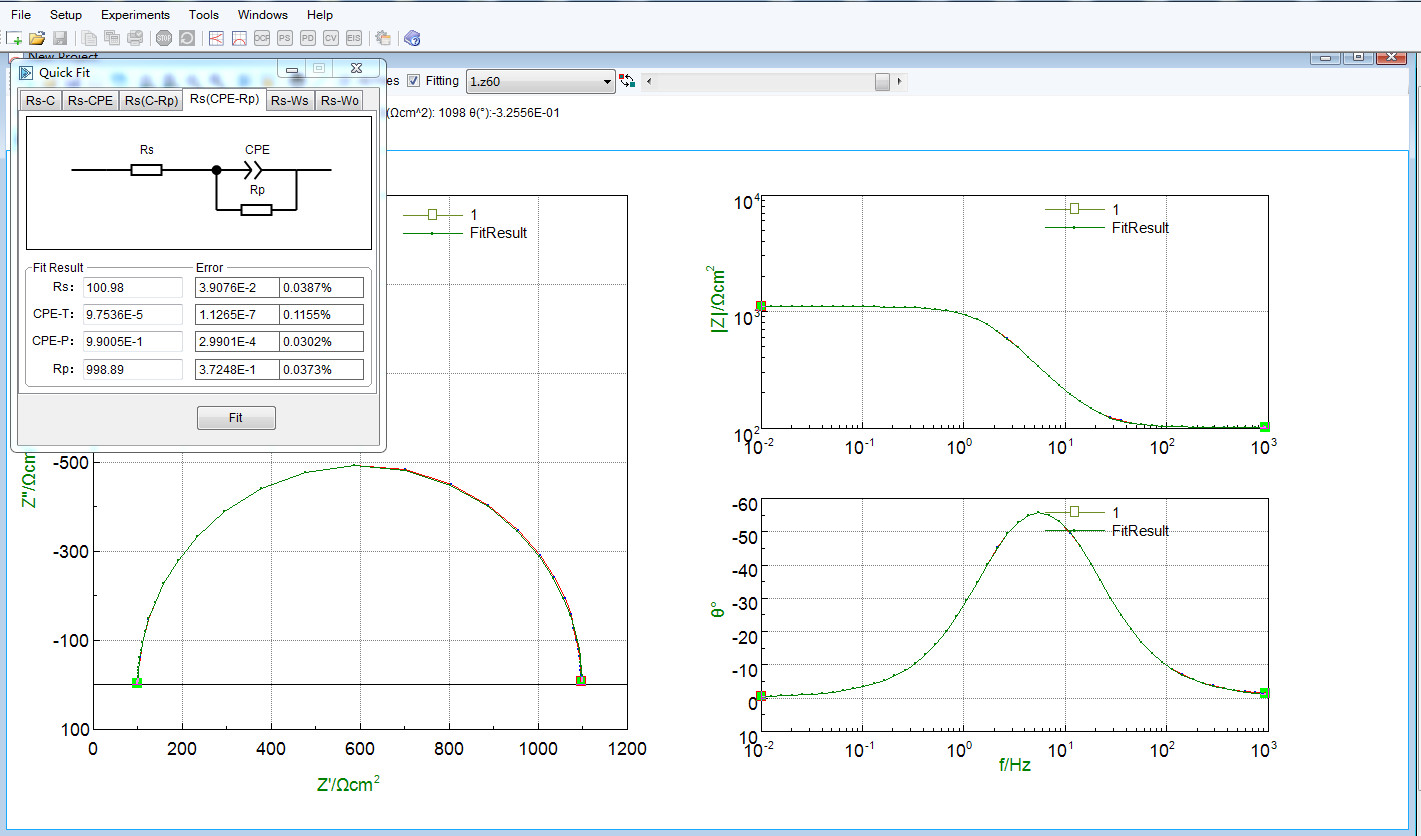
During EIS data analysis, there is built-in fitting function to draw the custom equivalent circuit.

EIS Electrochemical Impedance Spectroscopy Potentiostat And Galvanostat CS350M

Specifications of Electrochemical impedance spectroscopy potentiostat CS350M
Support 2-, 3- or 4-electrode system Potential and current range: Automatic
Potential control range: ±10V Current control range: ±2A
Potential control accuracy: 0.1%×full range±1mV Current control accuracy: 0.1%×full range
Potential resolution: 10μV (>100Hz),3μV (<10Hz) Current sensitivity:1pA
Rise time: <1μs (<10mA), <10μs (<2A) Reference electrode input impedance:1012Ω||20pF
Current range: 2nA~2A, 10 ranges Compliance voltage: ±21V
Maximum current output: 2A CV and LSV scan rate: 0.001mV~10,000V/s
CA and CC pulse width: 0.0001~65,000s Current increment during scan: 1mA@1A/ms
Potential increment during scan: 0.076mV@1V/ms SWV frequency: 0.001~100 kHz
DPV and NPV pulse width: 0.0001~1000s AD data acquisition:16bit@1 MHz,20bit@1 kHz
DA Resolution:16bit, setup time:1μs Minimum potential increment in CV: 0.075mV
IMP frequency: 10μHz~1MHz Low-pass filters: covering 8-decade
Operating System: Windows 10/11 Interface: USB 2.0
Weight / Measurements: 6.5kg, 36.5 x 30.5 x16 cm
Electrochemical impedance spectroscopy(EIS)
Signal generator
Frequency range:10μHz~1MHz AC amplitude:1mV~2500mV
DC Bias: -10~+10V Output impedance: 50Ω
Waveform: sine wave, triangular wave and square wave Wave distortion: <1%
Scanning mode: logarithmic/linear, increase/decrease
Signal analyzer
Integral time: minimum:10ms or the longest time of a cycle Maximum:106 cycles or 105s
Measurement delay: 0~105s
DC offset compensation
Potential automatic compensation range: -10V~+10V Current compensation range: -1A~+1A
Bandwidth: 8-decade frequency range, automatic and manual setting

Techniques - Electrochemical impedance spectroscopy potentiostat CS350M

Electrochemical Impedance Spectroscopy (EIS)

  • Potentiostatic EIS (Nyquist, Bode)
  • Galvanostatic EIS
  • Potentiostatic EIS (Optional freq.)
  • Galvanostatic EIS(Optional freq.)
  • Mott-Schottky
  • Potentiostatic EIS vs. Time (Single freq.)
  • Galvanostatic EIS vs. Time (Single freq.)

Stable polarization

  • Open Circuit Potential (OCP)
  • Potentiostatic (I-T curve)
  • Galvanostatic
  • Potentiodynamic (Tafel plot)
  • Galvanodynamic (DGP)

Transient Polarization

  • Multi Potential Steps
  • Multi Current Steps
  • Potential Stair-Step (VSTEP)
  • Galvanic Stair-Step (ISTEP)

Chrono Method

  • Chronopotentiometry (CP)
  • Chronoamperametry (CA)
  • Chronocaulometry (CC)

Voltammetry

  • Linear Sweep Voltammetry (LSV)
  • Cylic Voltammetry (CV)
  • Staircase Voltammetry (SCV) #
  • Square Wave Voltammetry (SWV) #
  • Differential Pulse Voltammetry (DPV) #
  • Normal Pulse Voltammetry (NPV) #
  • Differential Normal Pulse Voltammetry (DNPV) #
  • AC Voltammetry (ACV)
  • 2nd harmonic AC Voltammetry (SHACV)
  • Fourier Transform AC Voltammetry (FTACV)

Corrosion Measurements

  • Cyclic polarization curve (CPP)
  • Linear polarization curve (LPR)
  • Electrochemical Potentiokinetic Reactivation (EPR)
  • Electrochemical Noise (EN)
  • Zero resistance Ammeter (ZRA)

Battery test

  • Battery Charge and Discharge
  • Galvanostatic Charge and Discharge (GCD)
  • Potentiostatic Charging and Discharging(PCD)
  • Potentiostatic Intermittent Titration Technique (PITT)
  • Galvanostatic Intermittent Titration Technique (GITT)

Amperometric

  • Differential Pulse Amperometry (DPA)
  • Double Differential Pulse Amperometry (DDPA)
  • Triple Pulse Amperometry (TPA)
  • Integrated Pulse Amperometric Detection (IPAD)

Extensions

  • Electrochemical Stripping/ Deposition
  • Bulk Eletrolysis with Coulometry (BE)
  • Rs Measurement

# There is the corresponding stripping method.

Q: Why inductive reactance appears in the high-frequency region of Electrochemical impedance spectroscopy (EIS)?

A: Inductive reactance is mainly caused by the coil. Inductive reactance is positively correlated with coil length and frequency, and negatively correlated with the radius of the coil. It will be more obvious in the high-frequency region and lower resistance systems (such as batteries). To reduce it, please try to shorten the electrode cable, and also pay attention to not having other coils around the instrument or sample.

Q: When measuring Electrochemical impedance spectroscopy (EIS), do I need to wait for a while before measuring after building the testing system?

A: Doing EIS test you should make sure the testing system is a stable, and generally OCP observation is sufficient. Some systems, such as zinc-air batteries, need to wait to stabilize after assembly. While some, such as electrocatalysis, generally do not take long time to stabilize. OCP evaluation is the standard.

Q: There is no semicircle in my electrochemical impedance spectroscopy (EIS) test. What is the problem?

A: Not all samples have a small semicircle in EIS. The small semicircle exists in high frequency region, which is controlled by charge transfer. The straight line exists in the low frequency region, which is controlled by diffusion. For carbon material, the capacitance may be relatively large, showing an arc instead of a semicircle.

Q: Why the horizontal and vertical coordinates need to be consistent when plotting Electrochemical impedance spectroscopy (EIS)?

A: Because this is a complex plane. It is a requirement mathematically.

Send your message to this supplier
Send Now

EIS Electrochemical Impedance Spectroscopy Potentiostat And Galvanostat CS350M

Ask Latest Price
Brand Name :
Corrtest
Model Number :
CS350M
Certification :
CE, ISO9001
Place of Origin :
Wuhan, China
MOQ :
1set
Price :
Negotiable
Contact Supplier
EIS Electrochemical Impedance Spectroscopy Potentiostat And Galvanostat CS350M

Wuhan Corrtest Instruments Corp., Ltd.

Verified Supplier
1 Years
wuhan
Certification Level :
Verified Supplier
Contact Supplier
Submit Requirement