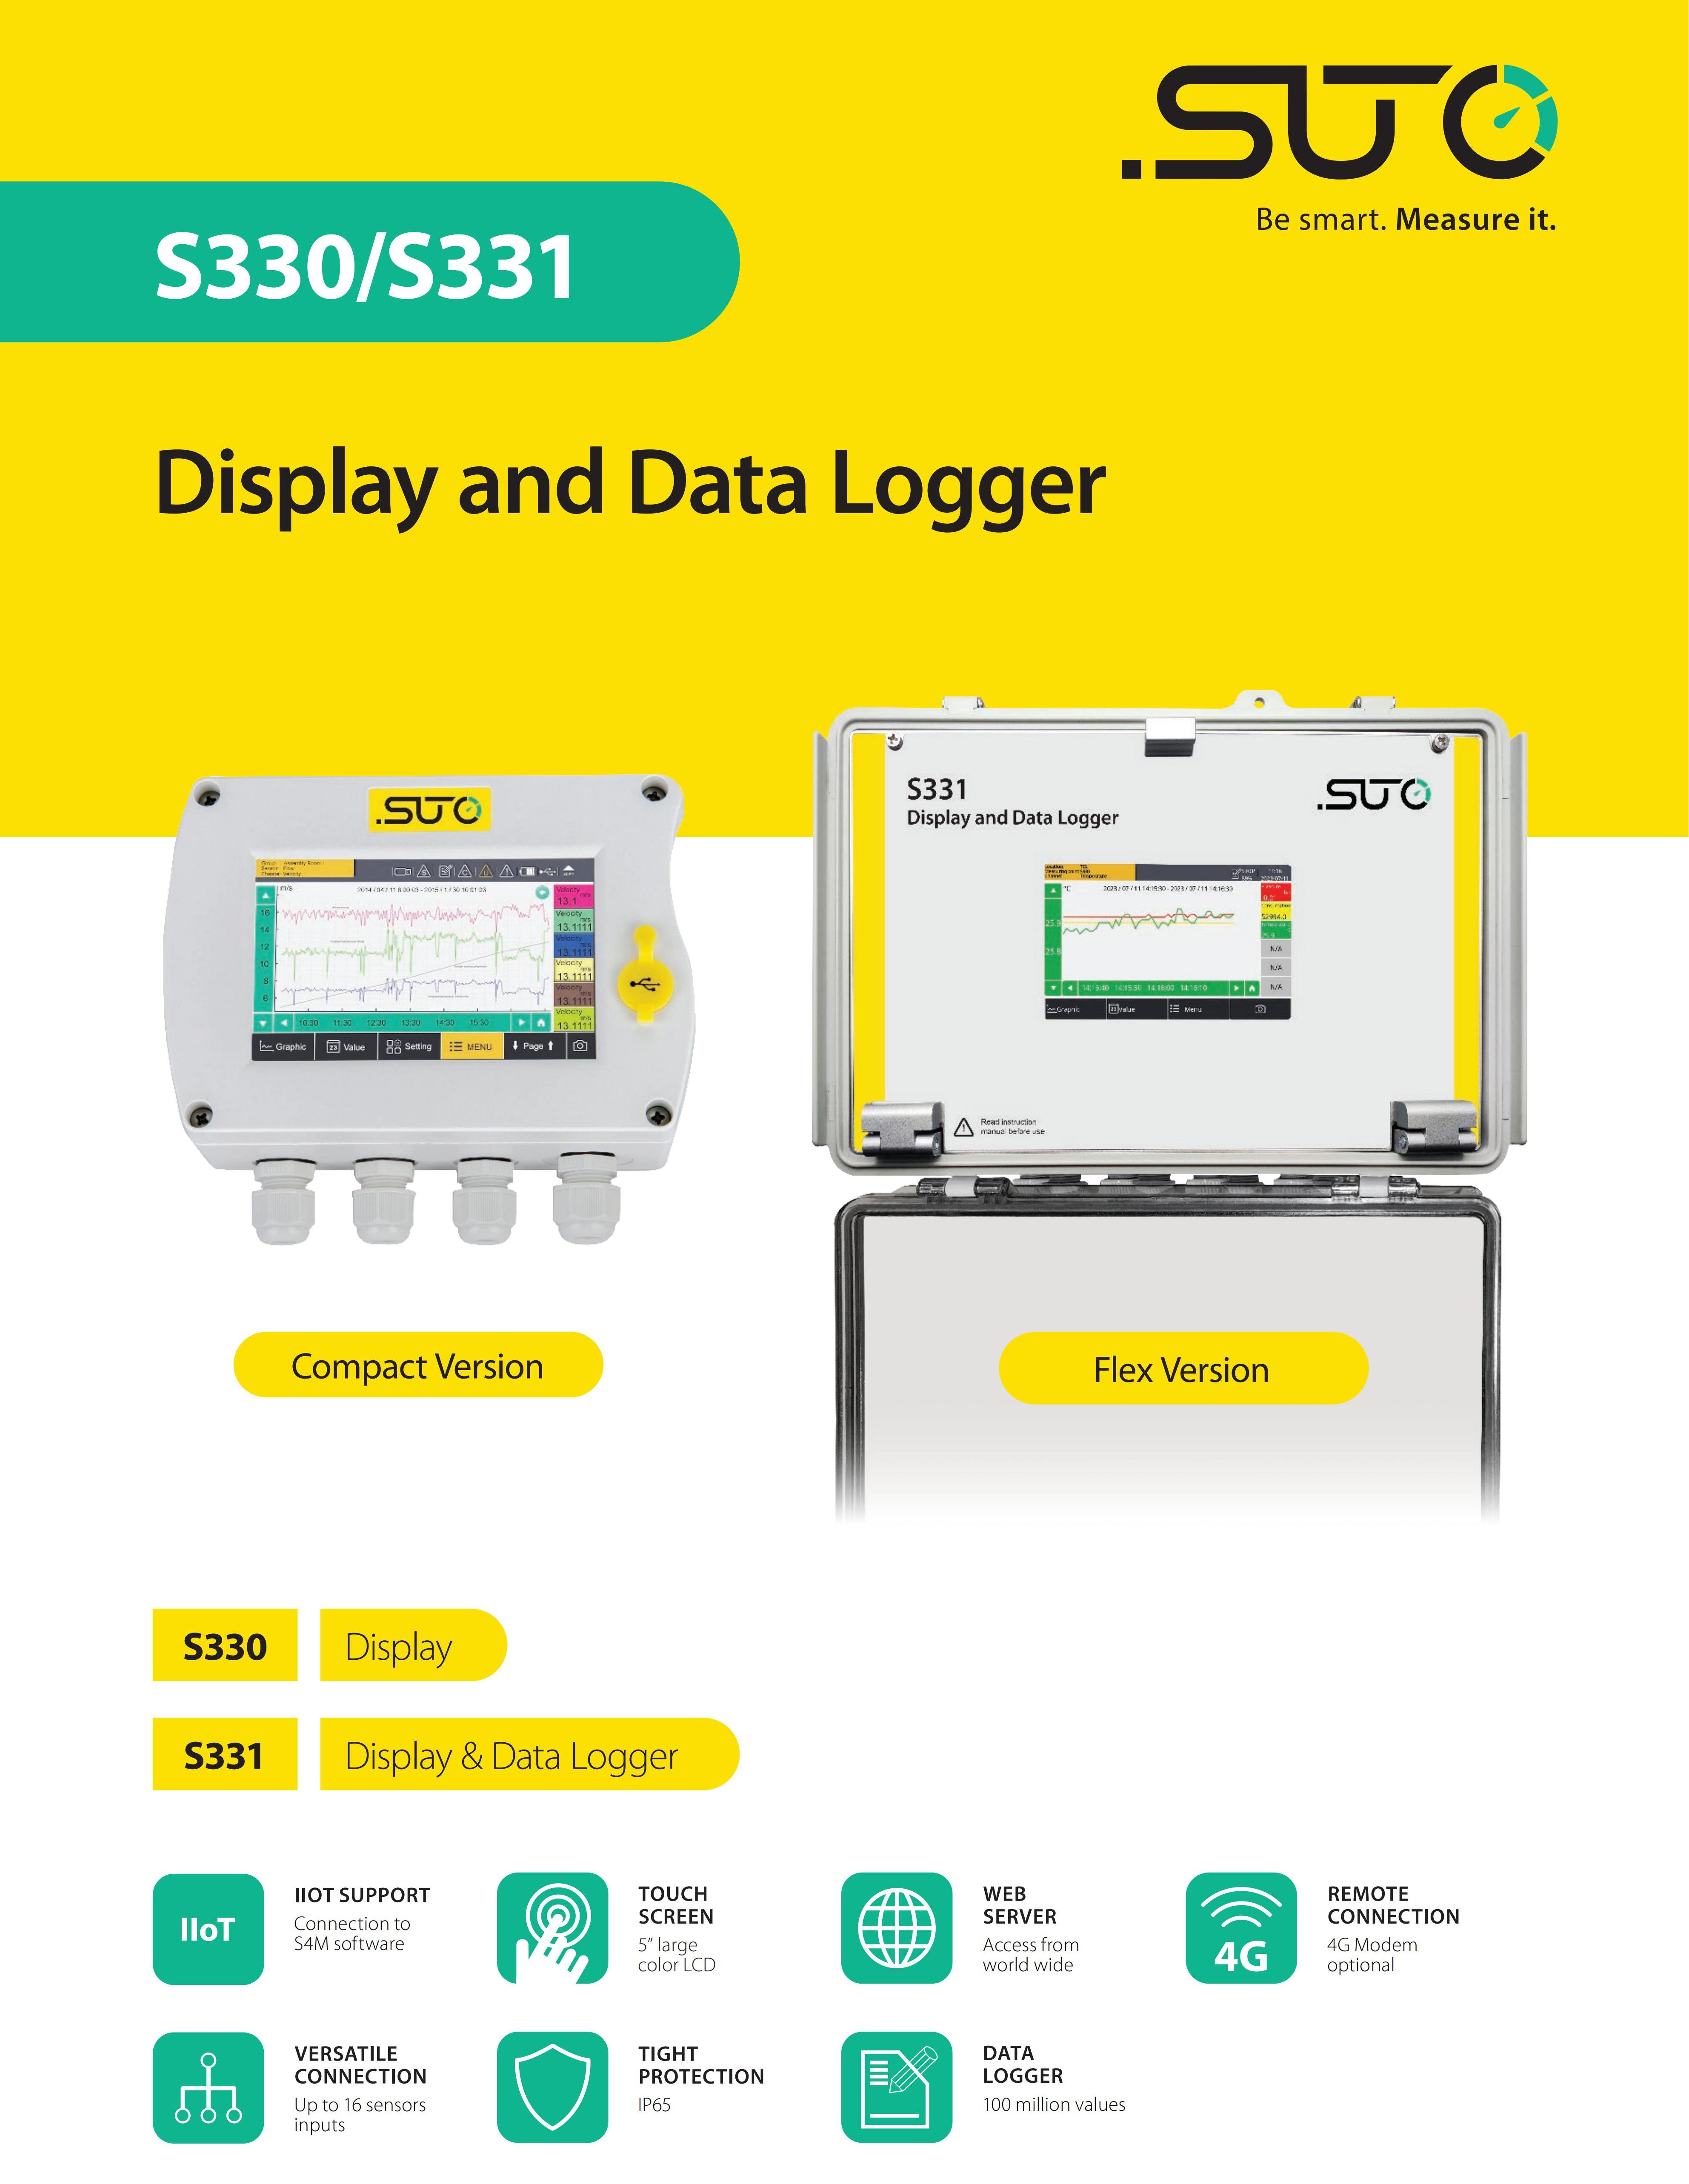
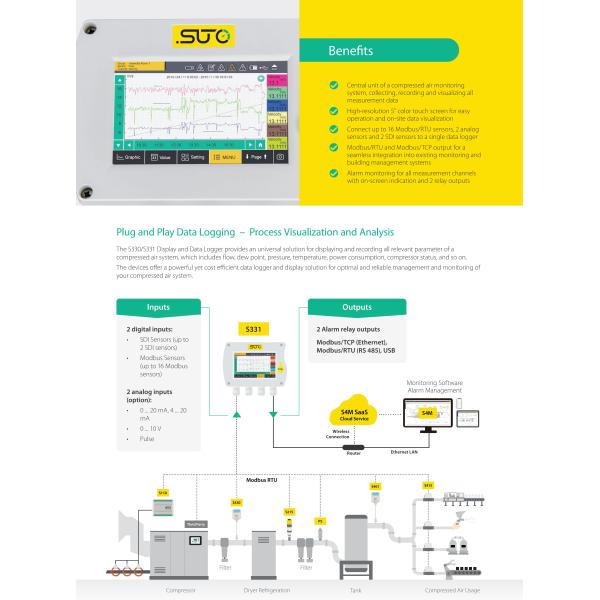
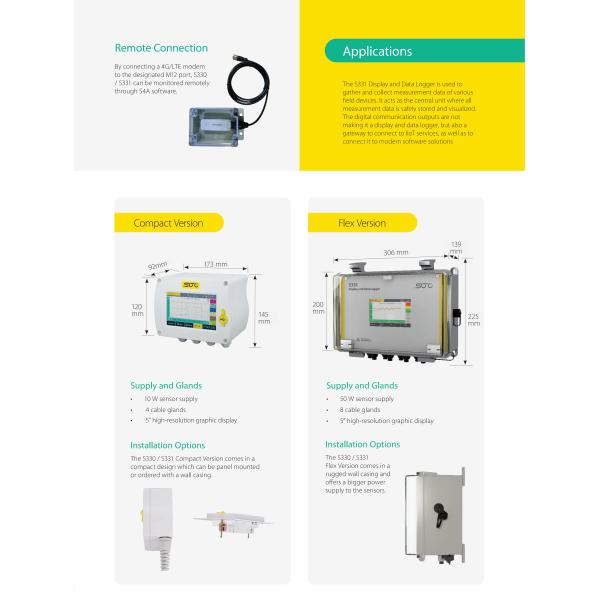
The S330 / S331 Data Logger and Display provides a universal solution for displaying and recording all relevant parameter of a compressed air system. This includes flow, dew point, pressure, temperature, power consumption, compressor status, and so on. The device offers a powerful yet cost-efficient data logger and display solution for optimal and reliable management and monitoring of your compressed air system.
S330: Display Solution
The S330 is a simple and easy-to-install display device with a high resolution 5” graphic display. This allows an easy operation where details are much sharper shown compared to many of the smaller low-resolution displays.
Various Connection Options
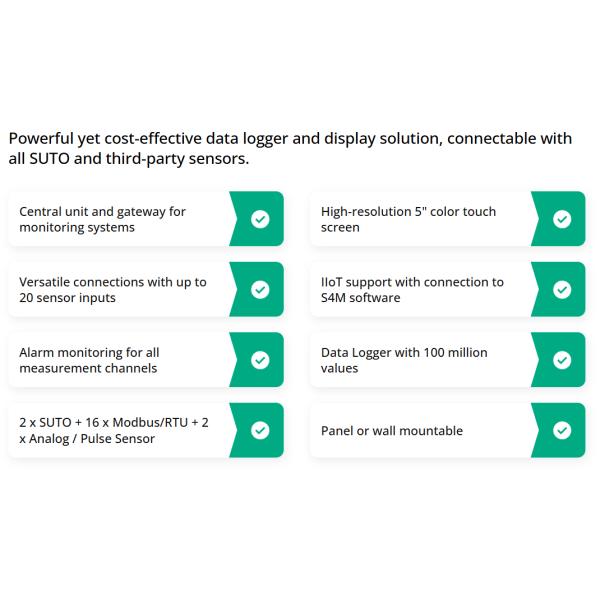
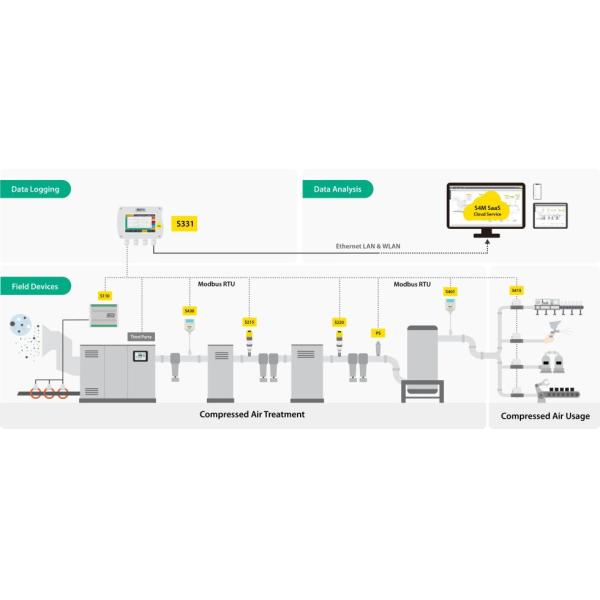
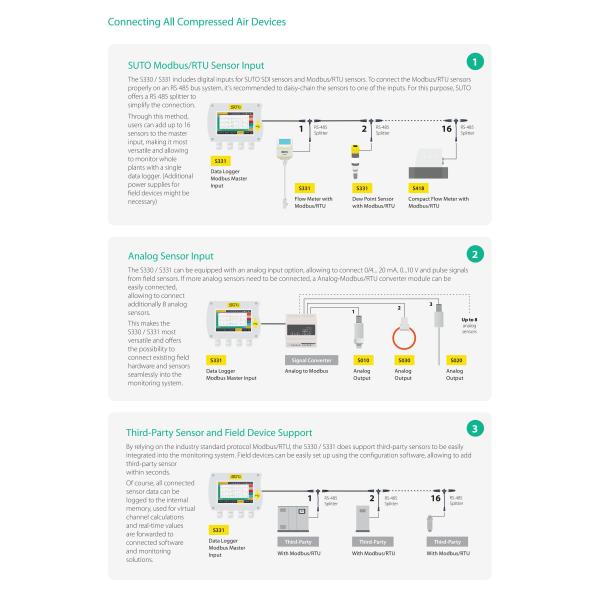
The S330 / S331 includes digital inputs for SUTO SDI sensors and Modbus/RTU sensors. To connect the Modbus/RTU sensors properly on an RS 485 bus system, it’s recommended to daisy-chain the sensors to one of the inputs. For this purpose, SUTO offers a RS 485 splitter to simplify the connection. Through this method, users can add up to 16 sensors to the master input, making it most versatile and allowing to monitor whole plants with a single data logger (Additional power supplies for field devices might be necessary).
Connect Third-Party Sensors and Field Device Support
By relying on the industry standard protocol Modbus/RTU, the S330 / S331 supports third-party sensors to be easily integrated into the monitoring system. Field devices can be easily set up using the configuration software, allowing to add a third-party sensor within seconds. All connected sensor data can be logged to the internal memory. This can be used for virtual channel calculations. All real-time values are also forwarded to connected software and monitoring solutions.
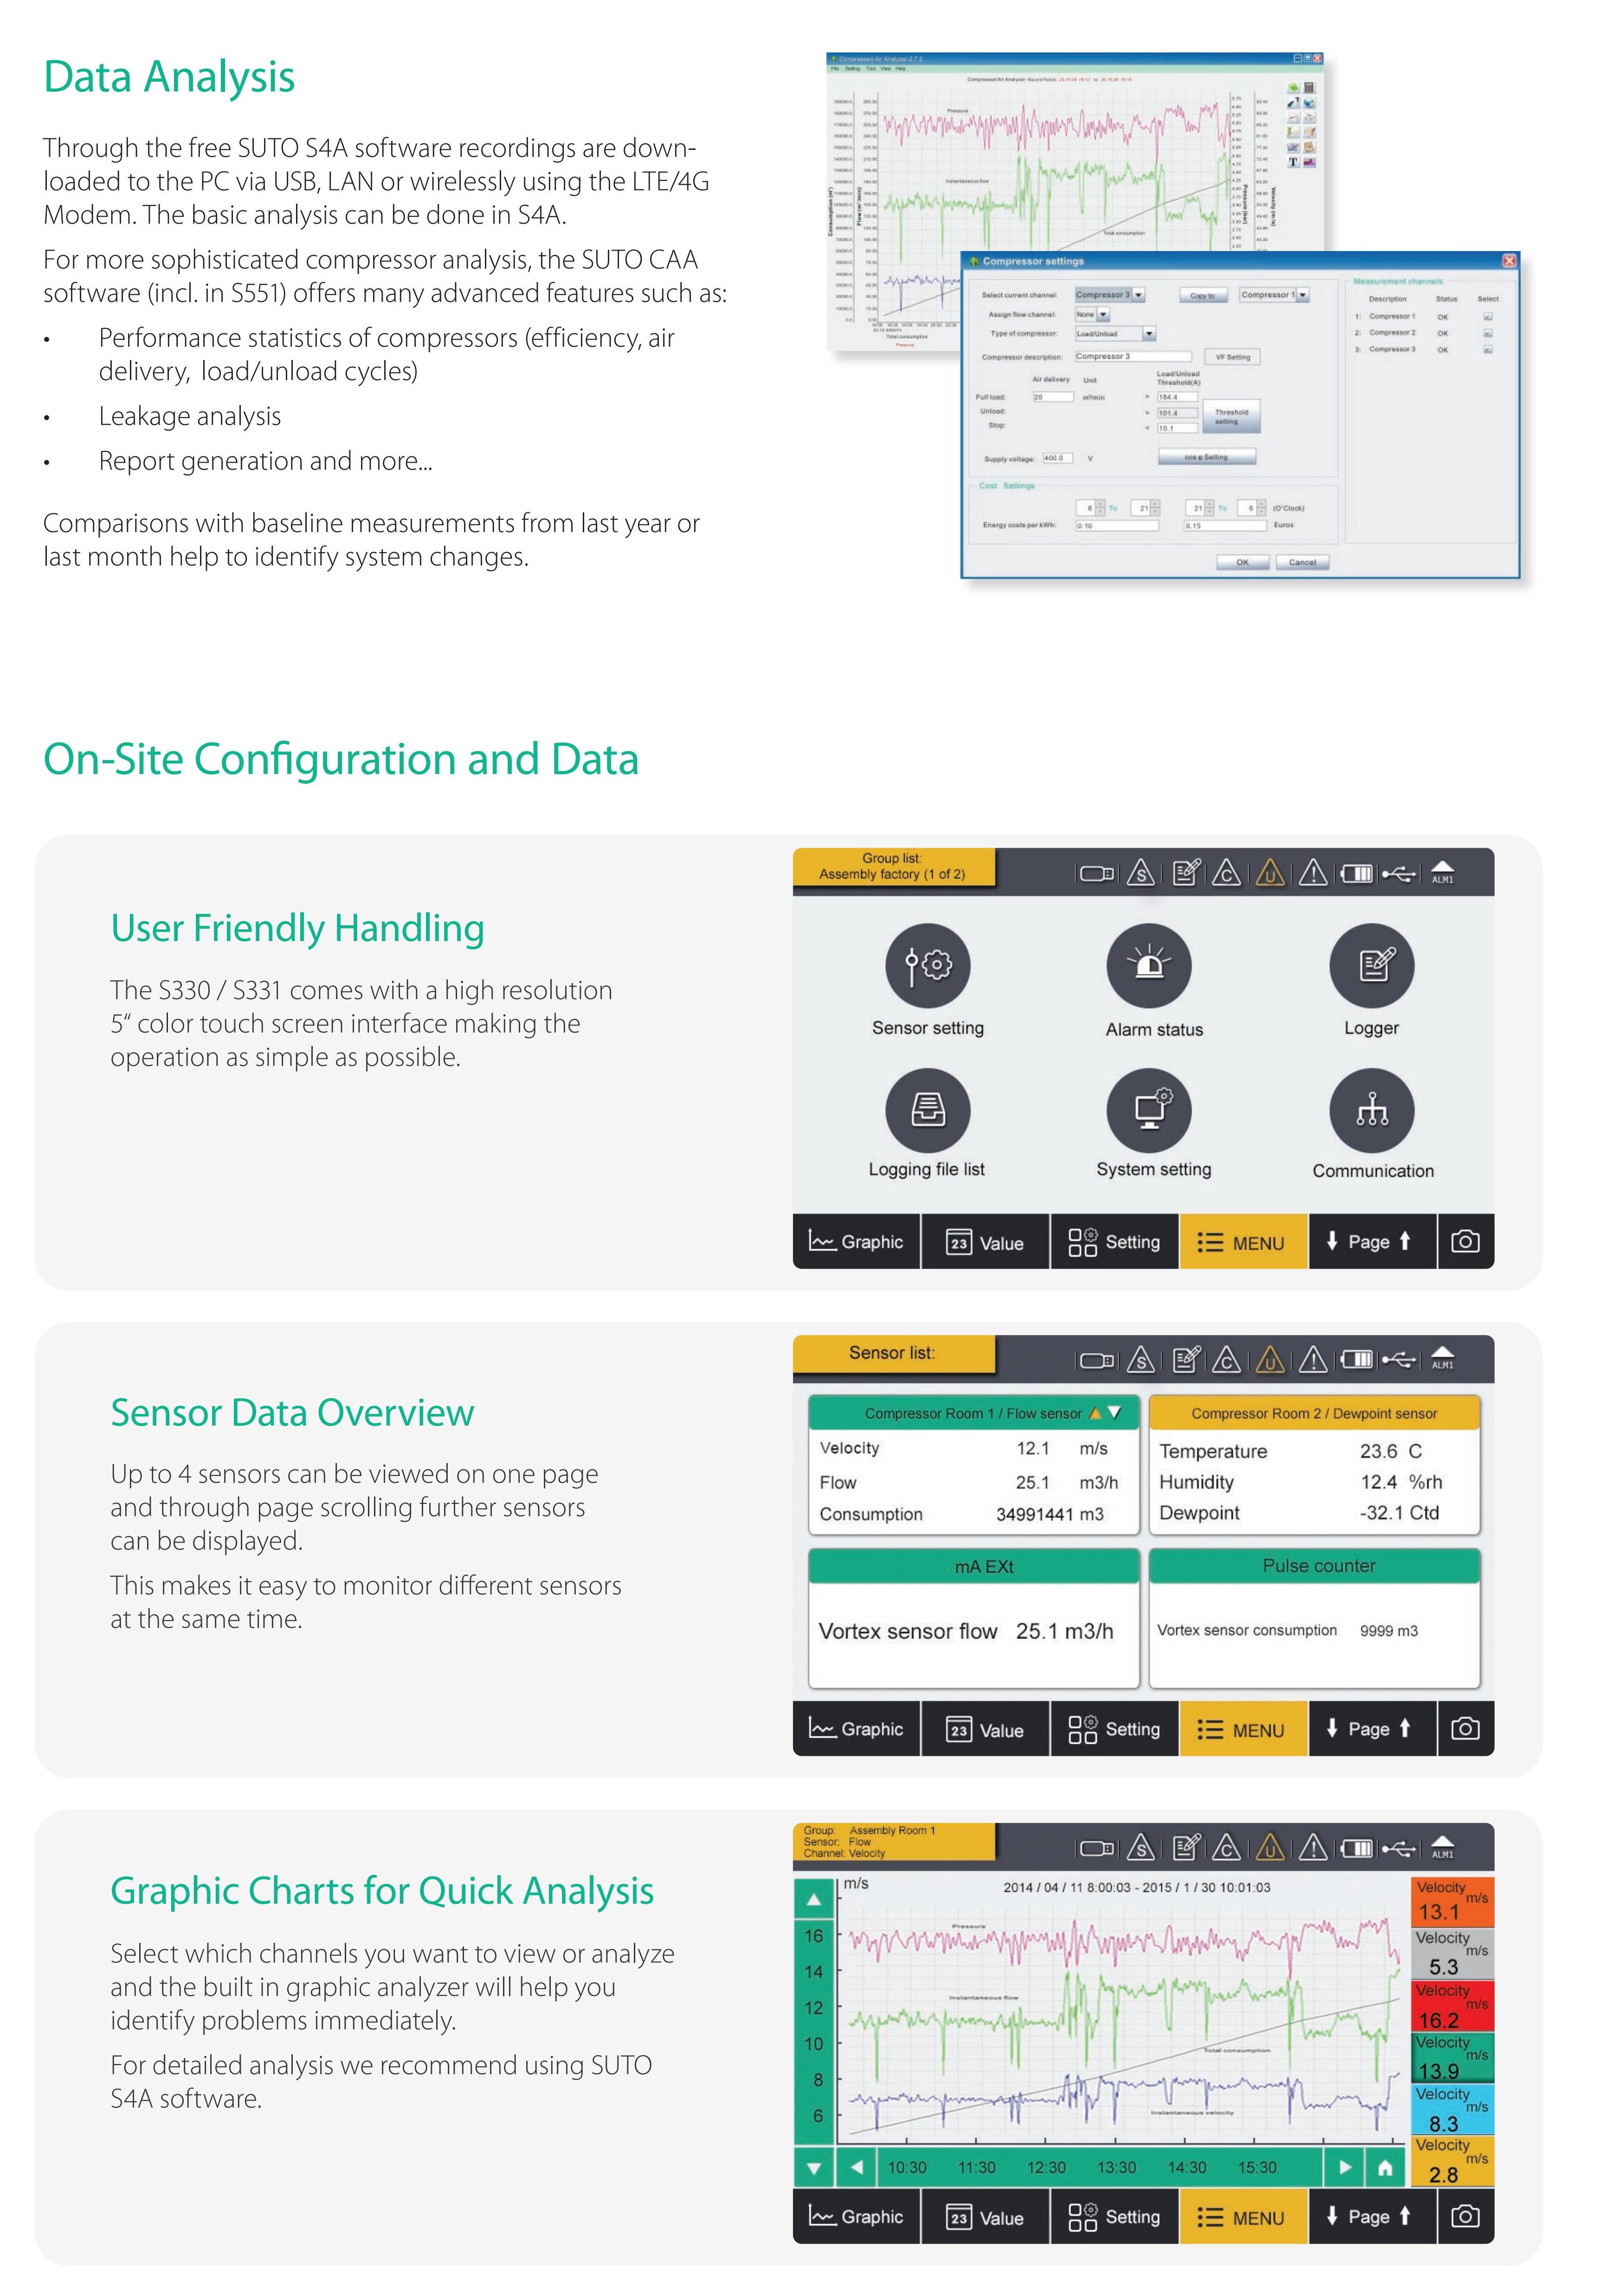
Collect Your Sensor Data for Further Analysis
Through the free SUTO S4A software, recordings are downloaded to the PC via USB, LAN or wirelessly using the LTE/4G Modem. The basic analysis can be done in S4M. For more sophisticated compressor analysis, the SUTO CAA software (incl. with the S551) offers many advanced features such as: Performance statistics of compressors like efficiency, air delivery, load/unload cycles as well as leakage analysis, report generation and more.
The universal display and data logger can display and record all relevant parameters (Flow, consumption, dew point, pressure, temperature, power consumption, compressor status etc.) in a compressed air system.
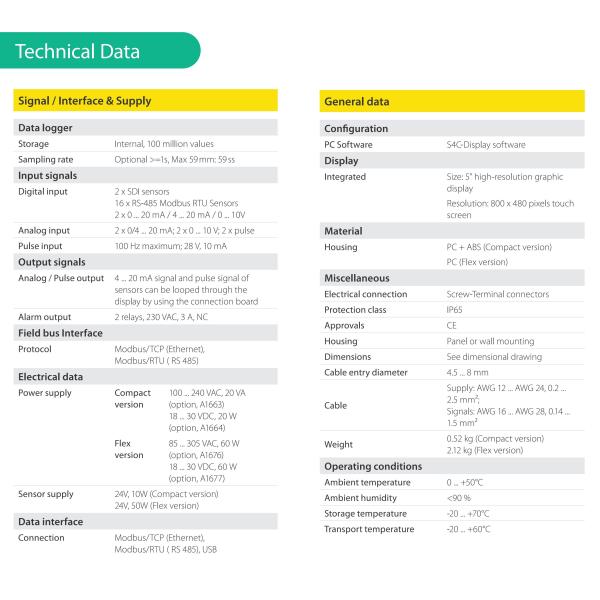
SIGNAL INTERFACE & SUPPLY | |
Data logger | |
Storage | Internal, up to 100 million values |
Sampling rate | Optional >=1s, Max 59 mm:59 ss |
Input signals | |
Digital input | 2 x SDI sensors 16 x RS-485 Modbus RTU Sensors 2 x 0 ... 20 mA / 4 ... 20 mA / 0 ... 10 V |
Analog input | 2 x 0/4 ... 20 mA; 2 x 0 ... 10 V; 2 x pulse |
Pulse input | 100 Hz maximum; 28 V, 10 Ma |
Output signals | |
Analog / Pulse output | 4 ... 20 mA signal and pulse signal of sensors can be looped through the display by using the connection board |
Alarm output | 2 Relais, 230 VAC, 3 A, NC |
Field bus Interface | |
Protocol | Modbus/TCP (Ethernet), Modbus/RTU ( RS 485) |
Electrical data | |
Power supply | 100 ... 240 VAC, 20 VA (option, A1663) 18 ... 30 VDC, 20 W (option, A1664) |
Sensor supply | 24 V, 10 W |
Data interface | |
Connection | Modbus/TCP (Ethernet), Modbus/RTU ( RS 485), USB |
GENERAL DATA | |
Configuration | |
PC Software | S4C-Display software |
Display | |
Integrated | Size: 5” high-resolution graphic display Resolution: 800 x 480 pixels touch screen |
Material | |
Housing | PC + ABS |
Miscellaneous | |
Electrical connection | Screw-Terminal connectors |
Protection class | IP65 |
Approvals | CE |
Housing | Panel, wall mountable |
Dimensions | See dimensional drawing |
Cable entry diameter | 4.5 ... 8 mm |
Cable | Supply: AWG 12 ... AWG 24, 0.2 ... 2.5 mm²; Signals: AWG 16 ... AWG 28, 0.14 ... 1.5 mm² |
Weight | 0.52 kg |
Operating conditions | |
Ambient temperature | 0 ... +50 °C |
Ambient humidity | < 90 % |
Storage temperature | -20 ... +70 °C |
Transport temperature | -20 ... +60 °C |